OpenClaw Skills Store Launches Data Analysis Plugin: My Short-Video Friend Changed Strategy After 3 Days
📖 Glossary
AI Box (also known as Agent Computer / Agent PC), is a dedicated local hardware device that runs AI Agents. Pre-installed with an AI agent management system, plug-and-play, running 24/7. Users can remotely command AI to work via Discord, Slack, Telegram, WhatsApp, and more.
My friend Lao Zhou has been running short-video accounts for three years. He manages four accounts and spends two hours every day just watching the numbers—likes, comments, shares, completion rates—logging everything manually in Excel. Three spreadsheets, a dozen pivot tables, and a handful of hand-drawn trend lines. That was his entire analytics stack.
Last weekend over dinner, he told me something that caught me off guard: after using OpenClaw's data analysis Skill for just three days, he completely overturned the content strategy he'd been running for half a year. Not a minor tweak. A full pivot.
The Data Analysis Skill Boom in OpenClaw's Ecosystem
OpenClaw's Skill ecosystem has been growing at a blistering pace throughout 2026. What started as a handful of utility plugins—browser automation, file management, email handling—has blossomed into a full marketplace with over 200 community-contributed Skills. And the fastest-growing category? Data analysis.
It makes sense. OpenClaw's core promise is running AI agents 24/7 on your behalf. If your agent can't analyze data, it's just a chatbot with a timer. The new wave of data analysis Skills transforms OpenClaw from a task executor into a genuine decision-support system.
The most downloaded data analysis Skills as of May 2026 include:
- akshare-data: 98 standardized interfaces for Chinese A-share market data, covering real-time quotes, historical K-lines, financial indicators, dragon-tiger lists, and capital flow. It's the backbone for anyone building automated investment research or quantitative strategy backtesting.
- tavily-search + analysis: Combines web search with structured data extraction, perfect for competitive analysis and market monitoring.
- Short-Video Analytics Suite: A community-built Skill that pulls performance data from Douyin, Kuaishou, and Xiaohongshu APIs, then runs trend detection and content gap analysis automatically.
- CSV/Excel Intelligence: Reads local spreadsheets, generates statistical summaries, identifies outliers, and produces visualizations on demand.
- SQL Query Agent: Connects to PostgreSQL, MySQL, and SQLite databases, allowing natural-language queries that get translated into optimized SQL.
Each of these Skills installs in under 60 seconds with a single command (openclaw skill install akshare-data), requires zero programming knowledge, and starts working immediately within your existing OpenClaw agent's workflow.
Lao Zhou's Story: Three Days That Changed Everything
Let me walk you through what actually happened when Lao Zhou installed the Short-Video Analytics Suite on his OpenClaw instance.
Day 1: The Setup
Lao Zhou was skeptical. He'd tried "AI analytics tools" before—dashboard products that promised the moon but delivered generic bar charts. But installation was literally one command:
openclaw skill install short-video-analytics
The Skill asked for his Douyin Creator credentials (OAuth, no password sharing), connected to his four accounts, and pulled the last 90 days of performance data. Within five minutes, his OpenClaw agent had a structured dataset with 2,847 content entries, each tagged with posting time, duration, category, and 14 engagement metrics.
The agent's first automated insight arrived at 8 PM that evening: "Your best-performing content window is Tuesday 7-9 PM, but you post most frequently on Thursday. There's a misalignment between your posting schedule and your audience's active hours."
Lao Zhou had never noticed this. He posted on Thursdays because that's when his content calendar said to post. The data said otherwise.
Day 2: The Pattern Recognition
On day two, the agent ran a deeper analysis. It segmented Lao Zhou's content into six thematic clusters based on topic modeling:
- Tutorials and how-tos (38% of posts, 45% of engagement)
- Behind-the-scenes vlogs (22% of posts, 28% of engagement)
- Product reviews (18% of posts, 12% of engagement)
- Trend-chasing memes (12% of posts, 8% of engagement)
- Personal stories (7% of posts, 5% of engagement)
- Announcements and promos (3% of posts, 2% of engagement)
The agent's second insight: "Your product review content has the worst engagement-to-production ratio. Each review takes 4-6 hours to produce but generates 60% fewer interactions per hour invested compared to tutorials. Meanwhile, your tutorial posts have the highest ROI but you're not increasing their frequency."
Lao Zhou was posting reviews because a sponsor was paying for them. But he was doing three reviews per week when the data suggested one would suffice—freeing up 8-12 hours for more tutorials.
The agent also flagged something unexpected: his 60-second tutorials consistently outperformed his 3-minute deep dives. The platform's algorithm was rewarding brevity in his niche, a pattern invisible to manual analysis because his gut said "longer = more value."
Day 3: The Pivot
By day three, Lao Zhou had his agent generate a complete content strategy overhaul:
- Posting schedule: Shift from Thursday to Tuesday/Wednesday, 7-9 PM window
- Content mix: Reduce product reviews from 3/week to 1/week, increase tutorials from 2/week to 4/week
- Format: Standardize tutorial length at 45-75 seconds, save deep dives for a weekly "premium" post
- Cross-platform: Repurpose top-performing Douyin tutorials as Xiaohongshu carousel posts (the agent identified a 3x engagement multiplier for this format adaptation)
The results after implementing these changes for two weeks: overall engagement up 34%, follower growth rate doubled, and Lao Zhou's daily analytics time dropped from 2 hours to 15 minutes. His OpenClaw agent now sends him a morning briefing at 7 AM with yesterday's numbers and today's recommendations.
Why Data Analysis Skills Hit Different
You might be wondering: couldn't Lao Zhou have gotten the same insights from a regular analytics dashboard? In theory, yes. In practice, there are three reasons why OpenClaw Skills deliver insights that traditional tools miss.
First: Always-On Analysis
Most analytics dashboards are passive. You open them, look at charts, and draw conclusions. OpenClaw Skills are active—they monitor continuously and push insights to you. Lao Zhou didn't have to remember to check his data; his agent noticed the posting-time misalignment autonomously and flagged it.
This is the fundamental shift: from "I'll check the data when I have time" to "the data will tell me when something matters."
Second: Natural Language Interaction
Traditional dashboards require you to know what questions to ask. You build a chart, filter by date range, compare segments. OpenClaw Skills let you ask questions in plain language: "Why did my engagement drop last week?" or "What type of content should I make more of?" The agent translates these into SQL queries, API calls, or statistical analyses, then explains the results in human terms.
Lao Zhou would never have thought to segment his content by production-time-to-engagement ratio. His agent suggested it unprompted because the data contained a signal worth surfacing.
Third: Cross-Platform Correlation
Lao Zhou's data lived in four separate platforms, each with its own dashboard and metrics. The OpenClaw Skill unified all of them into a single analytical framework, enabling cross-platform insights that no individual dashboard could provide.
The agent discovered that content posted on Douyin at 7 PM on Tuesdays generated 2.3x more Xiaohongshu traffic than content posted at any other time—a correlation invisible when looking at each platform in isolation.
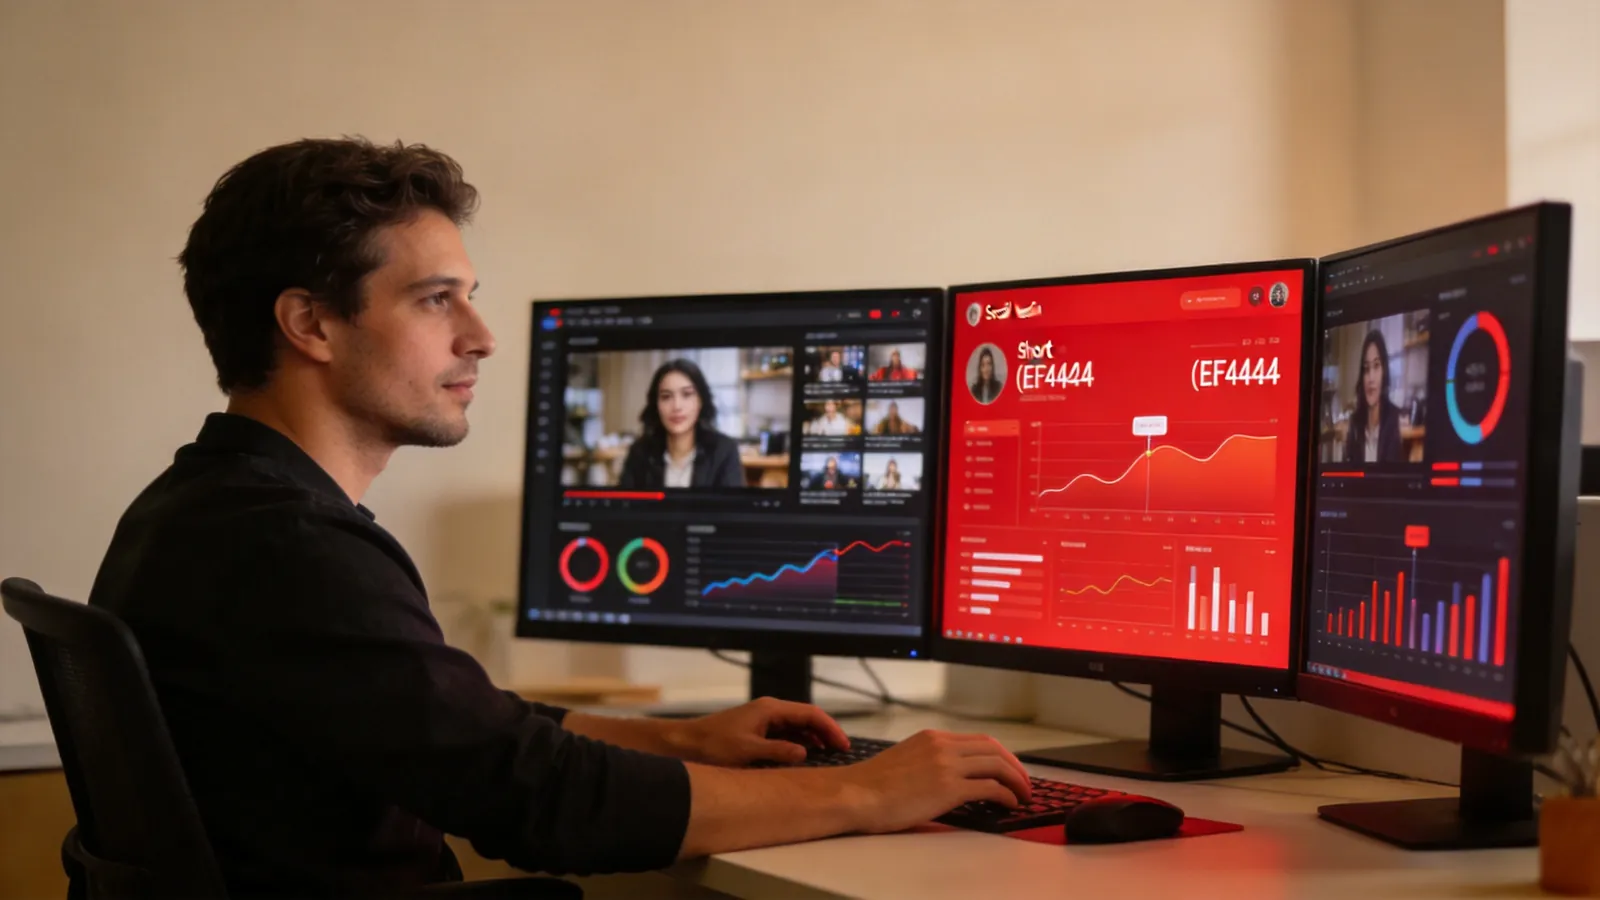
The Technical Architecture: How It Works Under the Hood
For the technically curious, here's how the data analysis Skill ecosystem operates within OpenClaw:
Data Ingestion Layer: Each Skill implements a standardized DataConnector interface that defines how to fetch, authenticate, and paginate data from external sources. The Short-Video Analytics Skill, for example, uses OAuth2 for Douyin, API key authentication for Kuaishou, and cookie-based session management for Xiaohongshu.
Processing Layer: Raw data flows into OpenClaw's local workspace as structured JSON files. The agent can then apply any combination of statistical methods—time series decomposition, clustering, regression, anomaly detection—using built-in Python libraries (pandas, scikit-learn, statsmodels) that ship with the Skill.
Output Layer: Results are rendered as markdown reports, interactive charts (via built-in chart libraries), or push notifications through whatever channel the user prefers (WeChat, Telegram, email). The agent decides the best format based on the insight's urgency and complexity.
Scheduling: OpenClaw's daemon runs 24/7, so data analysis tasks can be scheduled as cron jobs—daily summaries, weekly deep dives, or real-time alerts when metrics cross thresholds. This is where having a dedicated device like the Kaihe A1 becomes transformative: your analytics agent never sleeps, never forgets to run a report, and never misses an anomaly.
Getting Started: A 10-Minute Setup Guide
If you're ready to give data analysis Skills a try, here's the fastest path:
-
Install a Skill:
openclaw skill install akshare-data(for financial data) oropenclaw skill install short-video-analytics(for content analytics) -
Configure credentials: The Skill will walk you through OAuth or API key setup. Most take under 2 minutes.
-
Set up automated reports: Tell your agent what you want monitored. Example: "Check my Douyin analytics every morning at 7 AM and send me a summary via WeChat with any significant changes highlighted."
-
Iterate: After a few days, review the insights and refine your agent's monitoring criteria. The more context you give it, the smarter its recommendations become.
The entire setup requires zero programming. If you can type a natural language instruction, you can have a 24/7 data analyst running on your machine.
The Bigger Picture: Data Analysis as an Agent Superpower
Data analysis Skills represent a maturation of the AI agent ecosystem. The first generation of agent tools was about task automation—send emails, manage calendars, browse the web. The second generation is about decision intelligence—understand data, surface insights, recommend actions.
This shift matters because it moves AI agents from being mere tools to being genuine collaborators. A tool executes your instructions. A collaborator improves your decisions.
The OpenClaw Skills marketplace is still early, but the trajectory is clear: data analysis is becoming the default capability, not a premium add-on. Every agent should be able to understand the data that matters to you and tell you what it means.
For Lao Zhou, that meant finally understanding why his content strategy was stuck. For a stock trader using akshare-data, it might mean catching a momentum shift before the market opens. For a small business owner, it might mean identifying which product lines are dragging down margins.
The insights are already in your data. You just need an agent that can find them.
KaiheAiBox · OpenClaw Zone